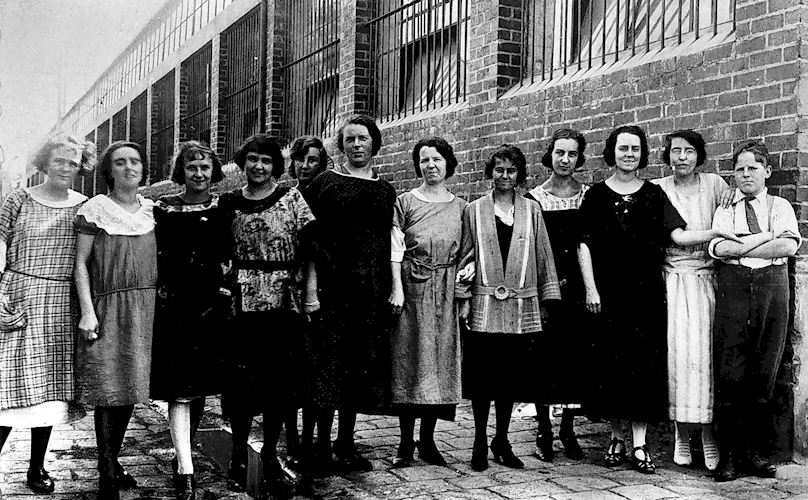
Photographer unknown. Museum Victoria, MM 8691.
Demographics for Collingwood over a decade from 2011 to 2021 derive from the Australian census data in profile.id and visualisations created in SBS Census Explorer. Originally featuring data from the 2011 census, then 2016, and now 2021, this shows the changes the suburb has undergone over a decade. The next census in 2026 will reveal even more about changes over a 15-year period. You can explore using this map from AURIN.

| 2021 | 2016 | |
|---|---|---|
| Population | 10,485 (2023) | 8,511 |
| Population Density | 7,232 people/km2 (2023) | 5,870 |
| Eligible Voters (18+) | 6,236 (68%) | 5,116 (60.1%) |
| Total Dwellings | 5,646 | 4,658 |
| Households with Children at Home | 14.9% (Greater Melbourne: 43.3%) | 16.3% (Greater Melbourne: 43.5%) |
| University Attendance | 8.9% | 9.4% |
| Tafe Attendance | 2.3% | 2.3% |
| Disengaged Youth | 9% | 7.4% |